
Monitoring your AVM devices #
AVM routers, repeaters and the like provide a TR-064 interface suitable for querying their status remotely. The Telegraf inputs.fritzbox Plugin makes use of this API to monitor your AVM devices.
See the plugin’s README.md about how to configure the plugin and start to collecting the status of your AVM devices.
Note regarding ‘fritzbox-telegraf-plugin’ #
This plugin was initially developed as an external plugin. I have reworked the plugin to eventually become a stock plugin of Telegraf from v1.35.0 on. During this process I also externalized the actual TR-064 access code to make it available for all kind of TR-064 API based tools. Further development will only happen on the stock plugin. The external plugin will no longer receive any updates.
Displaying the collected data using Grafana #
The plugin collects all kind of different data, usually displayed across multiple dashboards.
DSL connection status #
To visualize the DSL connection status within Grafana you may use the DSL Router status dashboard.
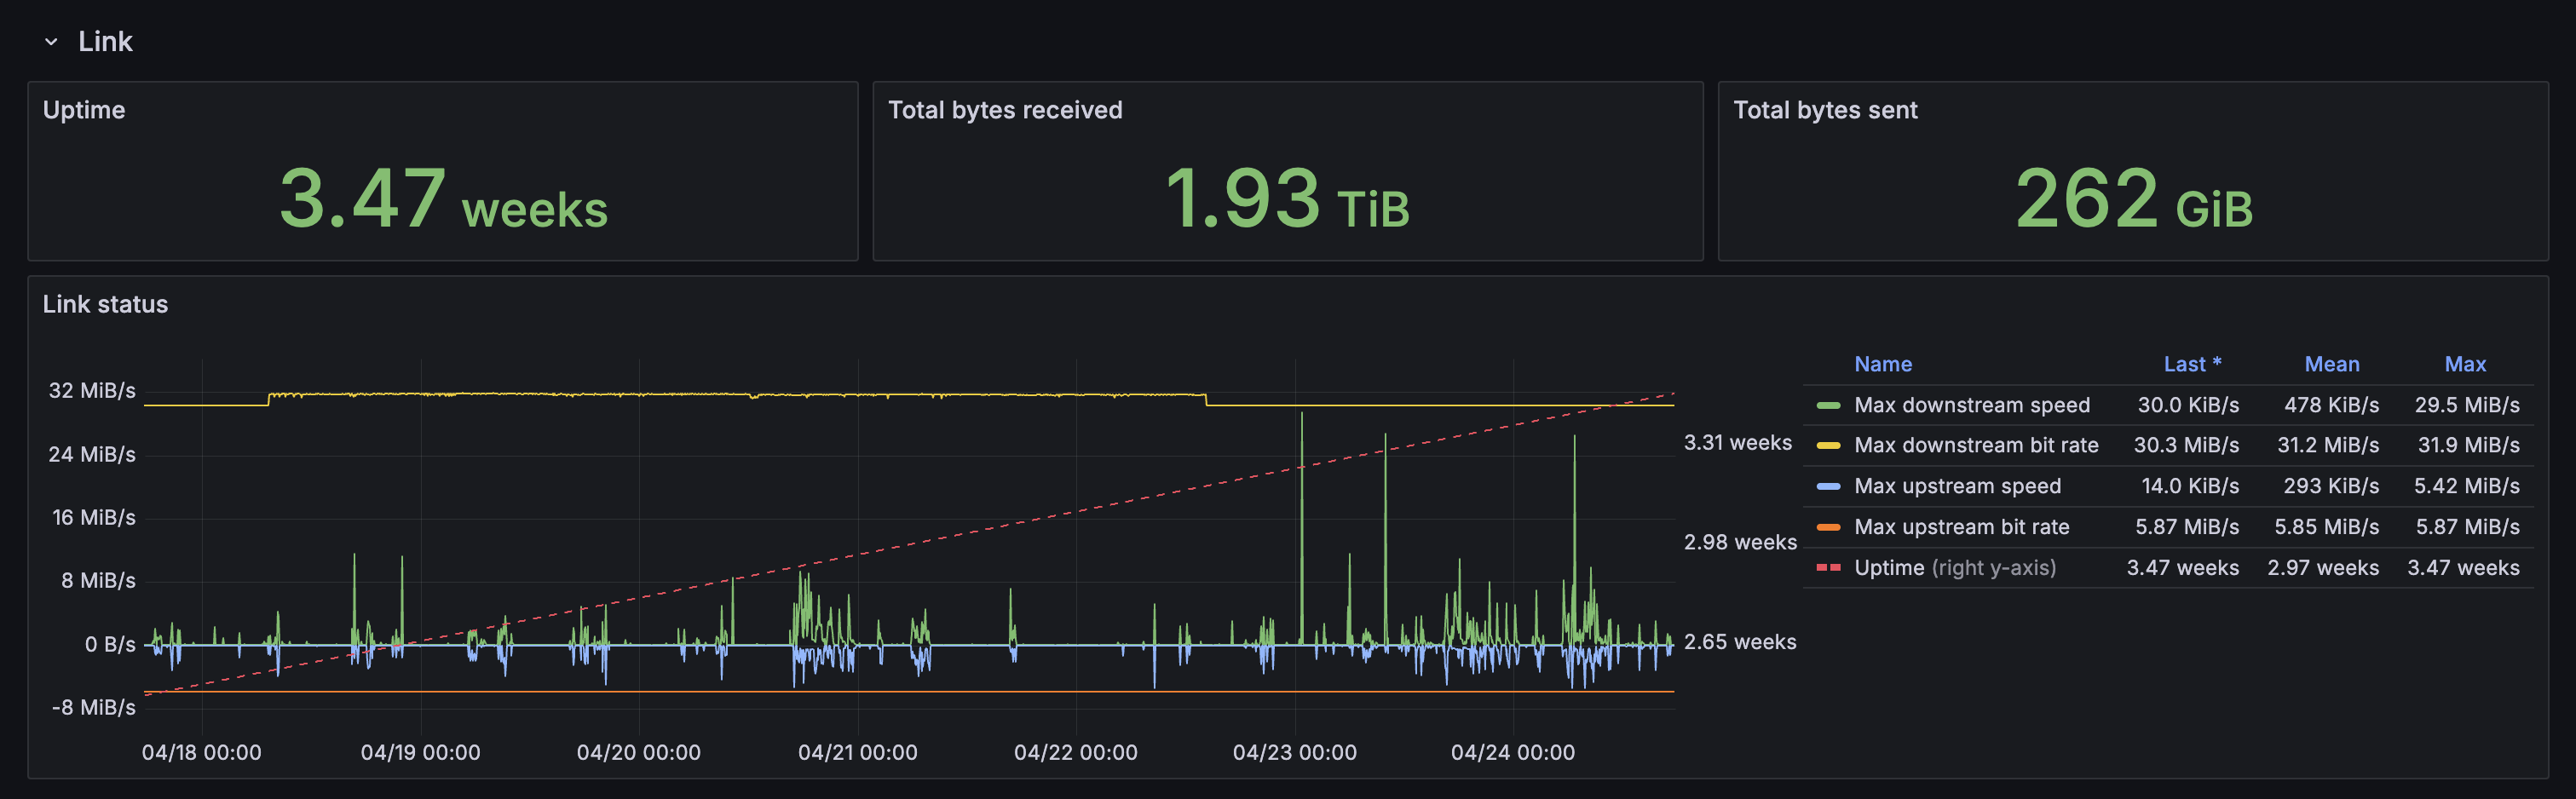
Link status #
The router’s upstream link uptime as well as its transfer and bandwidth rates.
DSL status #
The DSL connection parameters.

Errors #
The errors and events encountered on the DSL connection.

Mesh network status #
To visualize the Mesh network status within Grafana you may use the Mesh Network status dashboard.
Devices #
The devices spanning the Mesh network as well as their uptime.

Mesh #
The number of client connections per Mesh device and link.

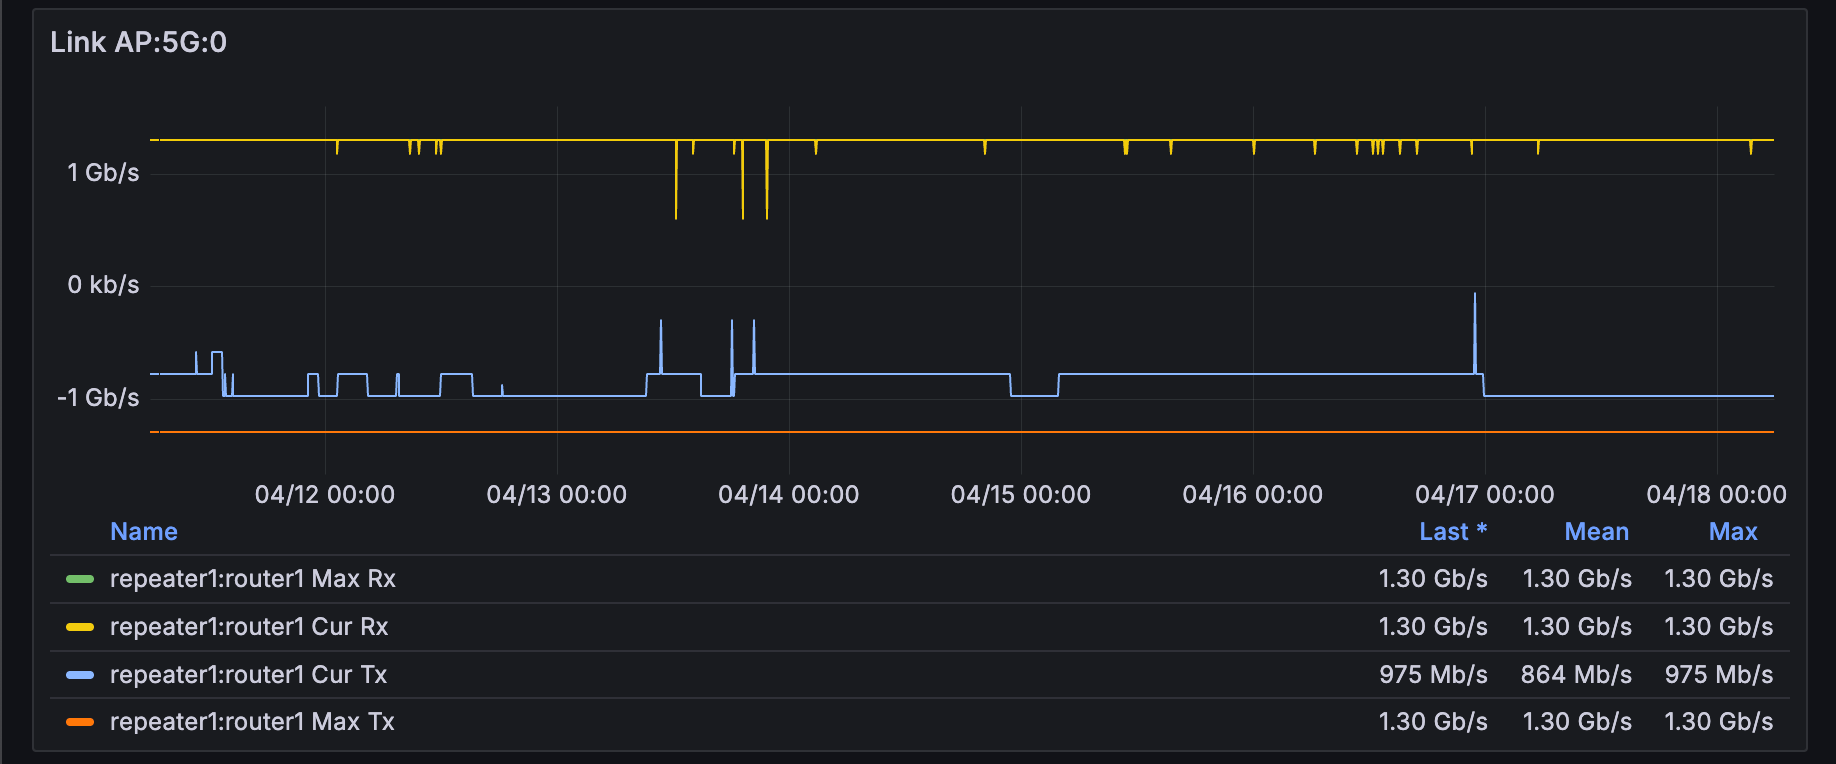
Mesh Links #
The Mesh links between the Mesh devices as well as their link parameters and bandwidth.
Mesh clients #
The clients connected to the Mesh network including the connection rate and bandwidth.
